A few days back I tweeted about a hybrid dashboard which would help you gauge the Capacity & Measure the performance of your virtual infrastructure from a single pane. I call it the Capacity & Performance Management Dashboard which has been jointly built by
Iwan Rahabok & myself.

In my last post I wrote about the
Help Desk Dashboard which was discussed during our VMworld session. This dashboard was also discussed in the VMworld session which me & Iwan presented and with this article, I will quickly run through the description of this dashboard, the use cases it solves and finally a quick and easy method to import this into your instances of vRealize Operations Manager. This dashboard does have 15 Super Metrics, 6 Views and 1 Customized XML file which helps you build the entire dashboard. While if you build this from scratch, creating this dashboard can take hours, but I promise you will spend under 10 minutes to operationalize this in your environment.
To begin with let’s have a quick look at the dashboard. :-
Here is a quick description of all the widgets of this dashboard:-
1- This lists all the clusters you are monitoring through vRealize Operations Manager 6.x
2- This widget display the key capacity metrics from a CPU, Memory & Storage perspective.
3- This widget provides the Peak & Average CPU Usage by an Virtual Machine in the selected cluster. This would basically give you an idea of how the virtual machines are using CPU in your environment. Is it Too Busy, Less Busy etc.
4- While the previous widget measure the usage, this widget looks at Peak & Average CPU Contention% which defines whether the demand of the CPU is being met without Contention at the CPU. Contention% is the key metric to measure CPU performance.
5- This widget provides the Peak & Average Memory Usage by an Virtual Machine in the selected cluster. This would basically give you an idea of how the virtual machines are using RAM in your environment. Is it Too Busy, Less Busy etc.
6- Similar to CPU Contention, for Memory performance you need to measure the Memory Contention %. With this widget we measure the Peak & Average memory contention experienced by any virtual machine in the cluster. The contention will be seen as soon as you have memory over-commitment and more demand than supply which is not a great sign.
7- This widget shows the Peak & Average IOPS done by any virtual machine in the selected cluster.
8- Alongside the IOPS you can see the Peak and Average Virtual Disk latency experienced by the virtual machines.
The above widgets showcase a number of metrics and most of them are Supermetrics which I will help you create in your environment!!
Here are the list of use cases where this dashboard can help you:-
1- Performance SLA Monitoring – If you have an agreed Performance SLA with the business measured in CPU & Memory Contention and Disk Latency then you can easily keep a track with this dashboard.
2- Performance Trending – Since this dashboard allows you to view the data from the past you can easily go back in time and look at how performance metrics trend in your environment.
3- Performance Driven Capacity Planning – This one is my favorite as you can now take capacity decisions based on your performance metrics. This basically means that if you need to ensure that as soon as you see performance metrics.
4- Capacity Overview – The capacity piece is quite obvious from the scorecard which talks about the consolidation ratios, summary of resources and the capacity remaining. With this in place you can easily see what kind of performance you are getting with over commitment of resources.
So if these reasons are compelling for you, let’s go ahead and get you this dashboard. Go ahead and download the following files by clicking on the links below. Once you have these downloaded, we will begin creating the dashboard.
One you have these files, let’s start with creating the dashboard. Follow the steps below:
IMPORT SUPERMETRICS & ENABLE THEM IN THE POLICY
1- Login to vROps with an account with Admin Privileges. Click on Content -> Super Metrics. Click on the Blue Wheel Icon and click on Import Super Metrics.
2 – Click the Browse button to go to SUPERMETRICS folder which you downloaded before and you need to select each super metric one by one and click on Open to Import all of them ONE by ONE.
3- One you import all of them, you will see a total of 15 Super Metrics in the list. Notice that these Super Metrics are already attached to the vCenter Adapter at the Cluster Compute Resource level.
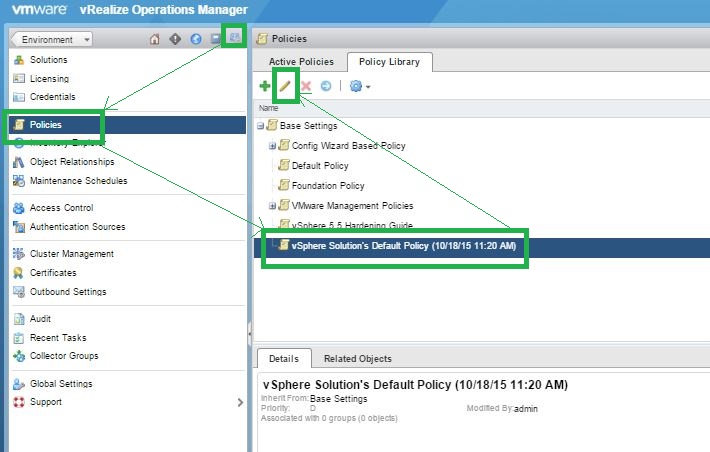
4- Now let’s enable these Super Metrics for collection in the Default Policy. Click on Administration -> Policies -> Policy Library -> Select the Default Policy – > Click on the Pencil shaped icon to Edit the policy.
5- Now click on the Collect Metrics and Properties option in the Edit Monitoring Policy Wizard and click on Collapse to see all the columns.
6- Click on Attribute type and uncheck everything except Supermetric to list all the of them.
7- In the Object Type select Cluster Compute Resource under the vCenter Adpater to list all the Super Metrics attached to a Cluster Object and you should see all the 15 super metrics which we imported earlier.
8- Finally, just select all the 15 metrics using CTRL + Mouse Left Click and click on Actions -> Enable to enable collection on all these super metrics.
Now that your Super Metrics are Ready, let’s import the Views after 5 minutes or so.
IMPORTING VIEWS
1- Click on Content -> Views -> Blue Wheel Icon -> Import
2- Browse to the file ALLVIEWS.xml which you downloaded before and click on open. Once the Views are imported you will see a successful message. Click on Done.
This would give you 6 new Views which the dashboard uses. Now let’s create an XML for the Capacity Score card.
XML CREATION
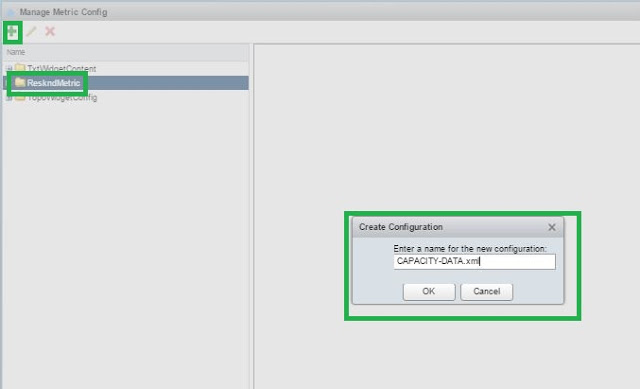
1- Click on Content -> Manage Metric Config (You need vROps 6.0.2 or above), highlight the ResKndMetric Directory and click on the Green + Sign to add an XML.
2- Name the XML as CAPACITY-DATA.xml and click on OK.
3- Here is the XML you need to copy on the right pane. Please ensure that you use the right XML here. You have the following choices.
Choice 1 – If you have done a fresh install of vROps 6.1 then use this xml highlighted in BLUE Color:
Choice 2 – If you are running on any version of vROps 6.0.x or upgraded to 6.1 from any of these versions then use the xml highlighted in RED
Once you have pasted the relevant xml click on Save.
IMPORT THE DASHBOARD
1- Click on Content -> Dashboards -> Blue Wheel Icon -> Import Dashboards
2- Browse to the downloaded file Cluster_cap_perf_db file and click on Open.

3- Once the Dashboard is imported successfully click on Done.
Phewww.. Guess what you have the dashboard now!! 🙂 Click on the Dashboard List option on the home page and you will see the Capacity Menu, click on that and you will see the Capacity & Performance Dashboard. Click on that to launch the dashboard.
Click on any of your Clusters to see the capacity scores and the performance data. Please remember that these super metrics would start calculating now, hence you need to wait for a day or two to get some data around performance. Usually after a week or so, you will have some good data to solve those use cases which I mentioned above.
Alright, so this is done!! Do share you comments on how this dashboard helped you!!
Don’t forget to share and spread the knowledge!!


Great Article Sunny. I tried to implement the same in our live and dev environment. In Live I don't see any option to import SMART METRIC. When I clicked on SMART Metric I don't see option to import it in right side window. Do we need to enable some option to get SMART Metric Option.In Dev, I can import but got stuck on 5th Point. I don't see any option to COLLECT METRIC While editing policy
LikeLike
Prashant looks like you do not have admin privelleges in your Production Environment.In your DEV you seem to have the rights required, you might see Override Attributes instead of collect metrics & properties since you might be using vROps 6.0.x and not 6.1. The screenshots are from vROps 6.1
LikeLike
Can I customize the vrealize operation manager dashboard and report with standard version. Can you share customized performance and utilization reports so that I can import and generate reports.Thanks.
LikeLike
You would need atleast Advanced Edition for Custom Dashboards and Reports.
LikeLike
In XML Creation, i cant find manage metric config. My vRops Version is 6.0.0.2263110.Please tell me the laternative way for the above.Thank You.
LikeLike
alternate way sorry typo
LikeLike
Hi Abdul,The manage metric config option is available in version 6.0.2.The alternate option is to login to the Appliance and place this file using a FTP client. Check this article for procedure.http://vxpresss.blogspot.sg/2014/03/part-1-creating-one-click-cluster.html
LikeLike
Really nice dashboard Sunny! Are the maximum CPU metrics for all VMs together or just the one VM with the highest usage? Average is just that, the avg of all VMs, yes?
LikeLike
Works with version 6.2, took me more than 10 minutes though, but worth the efforts, thanks Sunny and Iwan ! 🙂
LikeLike
@MikeGelhar – The max is for any VM with Highest. Average is average of all… Yup you are right.
LikeLike
This comment has been removed by the author.
LikeLike
Thanks Yandi.. 10 Minutes was marketing. 😉
LikeLike
Hi Sunny, This is great stuff, thanks very much!
LikeLike
Hi Sunny,I have version 6.0.0.2263110 in our setup. I am working to fine-tune the alerts. We configured and modify few alerts and apply them through policy.Some alerts updated and canceled whenever issue resolve but few alerts do not updated or canceled after resolve the issue.Can you suggest for the same and thanks for this great postBest regards, Vishal Garg
LikeLike
It looks like the download links are broken.
LikeLike
It looks like the download links are broken.
LikeLike
Yes same here, which is a pity. An alternative link maybe ?
LikeLike
Some alerts, especially the one related to availability would not cancel automatically, but have to be cancelled manually once the problem has been solved. This is by design.
LikeLike
Working on the broken links. should be online within a few hours.. stay tuned..
LikeLike
Working on the broken links. should be online within a few hours.. stay tuned..
LikeLike
Working on the broken links. should be online within a few hours.. stay tuned..
LikeLike
Working on the broken links. should be online within a few hours.. stay tuned..
LikeLike
How instal in 6.2?
LikeLike
Looks like fileas are not available for download…
LikeLike
I checked and they are available!
LikeLike
Same processs
LikeLike
hey, thanks for maintaining this post! Have referenced it a couple times – and finally tossing this into my own clusters, seeing what I can come up with. Would you have a quick minute to give me some pointers on looking at the \”Total VMs Remaining\” metric? I feel like I'm overlooking just something really basic in terms of trying to dig into this and tool it a bit. Thanks,
LikeLike
This comment has been removed by the author.
LikeLike
Hi Sunny,Great post! I got it almost working.I'm running 6.5.0 and can't get the vCPU:pCPU & vMEM:pMEM working. The background remains gray and the shown value is ?:1Any tips on what to try?TiA!
LikeLike
I am also seeing similar behaviour with the vMEM:pMEM ratio not working – any insight would be greatly appreciated.Thanks
LikeLike
Look like the metric being used there could be disabled in the policy. You would need to enable that iun the policy.
LikeLike
Look like the metric being used there could be disabled in the policy. You would need to enable that iun the policy.
LikeLike
Search for \”mem|demand|vConsumption.per.pConsumption\” in the default policy and enable it. This is a capacity metric and will be calculated every day on 9 PM. You will mostly see the results next day.
LikeLike
Search for \”mem|demand|vConsumption.per.pConsumption\” in the default policy and enable it. This is a capacity metric and will be calculated every day on 9 PM. You will mostly see the results next day.
LikeLike
Hi i am running vrops version 6.7.0 i am not able to find mem|demand|vConsumption.per.pConsumption\” in the default policy can you help please.Thanks
LikeLike
Running 6.6.1 here. When I select a cluster the \”Cluster Capacity Details\” widget (top right) populates with correct data, but none of the other widgets populate. The Widget Interactions appear correct. When I edit one of the views and select a preview source it shows \”No data to display\” when I select a cluster. The super metric name appears as a long string instead of the name (perhaps normal?) When I manage the Super Metric and select a cluster object it DOES correctly show the chart. This same chart does not show in the view however. Any ideas?
LikeLike
Hi Sunny, Can this be worked on vROPS ver 7.5.0? I did try but it seems my following widgets are not working? Any help will be great.vCPU:pCPUvMEM:pMEMTotal VMs RemainingCPU-VM RemainingMemory – VM RemaingPlease if you can assist as i have been trying to get this info for quite some time for our environment. Thanks Harry
LikeLike