Let me begin this post by thanking all the readers of vXpress who voted this year during the TopvBlog2015 survey. I am happy to share that your support and encouragement has helped vXpress retain a spot in the Top 50 Virtualization blogs in the year 2015 as well by being ranked as number 38 in the world. Here are the full results of this years ballot. I will continue to share my experiences through this blog and I hope that the quality and the quantity of the content increases this year as compared to the previous year.
On this note, I should share that in March 2014, I wrote a post on creating a one-click cluster capacity dashboard in vCOps. I must say that the response I got on that post was enormous and that dashboard was replicated in hundreds of vCOps installations across the globe. Since the release of vRealize Operations Manager, I have received an over-whelming amount of requests to re-create the one click cluster capacity dashboard on vROps 6.0. I should mention here that the dashboard which I created with vCOps 5.x would not work with vROps 6.0, since a number of metrics have changed in vROps 6.0 and the one which remain are also laid in a different pattern within the database.
So without further ado, let me quickly show you the face of the NEW ONE CLICK CLUSTER CAPACITY DASHBOARD….

Just like the previous version of the dashboard, you would need to click on the cluster name on the left pane which will give you the details of the cluster and the important capacity metrics. With vROps 6.0, I have selected the metrics which I believe are important and would give you an overview of the cluster. Let me quickly explain these 16 metrics to you.
- Total Hosts = Total number of hosts in the cluster
- Total Datastores = Total number of datastores in the cluster
- Total VMs = Total number of virtual machines
- Powered on VMs = Number of powered on VMs in the cluster
- VM:HOST = Average number of running virtual machines per running host.
- vCPU:pCPU = Ratio of CPU consumption to provision based on consumer demand
- vMEM : pMEM = Ratio of Memory consumption to provision based on consumer demand
- WASTAGE% = Overall score of waste, on a scale of 100
- VM Remaining Average = Capacity remaining based on average consumer demand
- CPU – VM Remaining = Capacity remaining based on average consumer CPU demand
- Memory – VM Remaining = Capacity remaining based on average consumer Memory demand
- Disk – VM Remaining = Capacity remaining based on average consumer Disk Space demand
- VM Remaining Large = Capacity remaining based on Large consumer demand
- VM Remaining Medium = Capacity remaining based on Medium consumer demand
- VM Remaining Small = Capacity remaining based on Small consumer demand
- VM Remaining Average = Capacity remaining based on average consumer demand
In case you want some more or other metrics to show up in your scoreboard widget, then you can refer to the vROps Admin Guide here which gives you the description of various metrics available.
Now let me tell you how to replicate this dashboard in your environment. Here are the pre-requisites:-
- vRealize Operations Manager 6.0.1
- Advanced Edition or Above
- Administrative Access to vROps
- Internet Explorer or Mozilla Firefox
Here are the steps to replicate the dashboard.
- Login to your vROps instance with an administrator account. (This could be to any instance of the cluster in case you are running a vROps Cluster).
- Click on Content – > Manage Metric Config -> Expand the folder “ReskndMetric” -> Click on the Green PLUS Sign to add a new XML -> Name the file as “cluster-cap” (without .xml extension) Copy the xml content highlighted in RED from below and paste it on the right window -> Click on Save.
Once you are done with creating this file, you now need to import a dashboard which is called “CLUSTER CAPACITY DASHBOARD” To import this dashboard you need to download the following file: CLUSTER-CAP.json (click on the filename to download).
Once you have this file, let’s see the steps to import it.
- Login to your vROps instance with an administrator account. (This could be to any instance of the cluster in case you are running a vROps Cluster).
- Click on Content – > Dashboards -> Actions -> Click on the Import Dashboard.
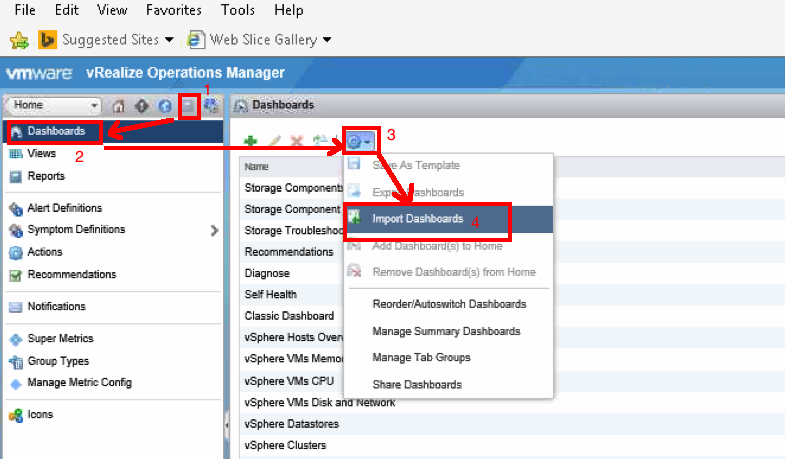
- Browse to the CLUSTER-CAP.json file and click on Ok.
This will bring the Cluster Capacity Dashboard in the list of dashboards which you have..

Hope you enjoy the new Cluster Capacity Dashboard!!
Share & Spread the Knowledge!

Great job as always Sunny! Small correction:Click on Content – > Manage Metric Content -> …SHOULD READClick on Content – > Manage Metric CONFIG-> …Cheers!
LikeLike
Thanks.. I will update the article… Glad you liked the dashboard!!
LikeLike
I don't understand what super metric you are using for the CPU – VM Remaining.
LikeLike
It is not a Super Metric, its just a normal metric What don't you understand, I can help you!!
LikeLike
So I am trying to understand why my dashboard shows no more availalbe vm's based on the CPU-VM Remainaing. http://imgur.com/IbuAQauWhen if I look from the vcenter side I am barely using 10% of what is possible.http://imgur.com/dyvua4S
LikeLike
That is because of the policy which drives the results.. Have you made changes to the default policy. Also, if you select the same cluster and look at the capacity number within the environment do you see the same numbers??
LikeLike
Ok that was what was going on, I had not changed the Default Policy but i had applied some of the out of the box Policy's to some of my Compute Clusters (the ones having issues). I have removed those Object from those Policy's and Now the numbers look much more accurate. Thanks for you help Sunny! Your Dashboard for the previous version was one of my favorites, and I believe you have done it again with this iteration.
LikeLike
Awesome… Glad you solved the issue… Rather corrected the policy. The out of the box policies are either too conservative or too aggressive. I prefer using the Base Settings and then make my own changes as per the requirements.I am glad you liked the Dashboards…Stay tuned for more to come.RegardsSunny
LikeLike
Hi Sunny. I'm having same problem as Unknown above. I'm not really sure how to check in regards to default policy. I made a change to it where i enabled super metric i added on all object types and cluster compute resource like its listed here:https://www.dropbox.com/s/eiyy2aijx61lv4c/Screenshot%202015-06-11%2009.12.02.png?dl=0is this what is causing the issue or is it something else?ThanksAlex
LikeLike
The super metric has nothing to do with the number of VMs Remaining Metric. The Default Policy which you are using has a Consolidation Ratio which is on the basis of allocation. Either this ratio or the demand for that particular metric is driving the result for number of VMs remaining.
LikeLike
how do i import dashboard in vrops 6.1.. don't seen an option
LikeLike
Hey Kris… Could you please explain as to what option you are referring to. If it is the Import Dashboard option under, Content->Dashboards-> Import Dashboards is greyed out then it could be a permissions issue. Please provide more details to provide you a solution.
LikeLike
Hi, Using 6.1.0.3292452. Dont'see the import Dashboard option.Tried creating new admin user with access to all objects. Same issue. See the screenshot below.https://drive.google.com/file/d/0B2_Uevjq-n4MRHlickowWV81Mm8/view?usp=sharing
LikeLike
Just realised vrops requires standard version of license key aswell.. which resolved the issue. thank you offering to help
LikeLike
Yup.. you need the advanced or enterprise edition..
LikeLike
Hello, is there a way to run a report on this dashboard? When I try to setup a report it doesn't run on the cluster I select and the format it a little off.
LikeLike
Just set up the dashboard but it shows ? for all metrics besides total hosts, total datastores, total VMs, running VMs and VM count per host. Any ideas?
LikeLike
I got this all configured but the dashboard is blank aside from the cluster chooser. Any guidance would be helpful.Thanks,mike
LikeLike
Click in the edit icon to edit the scorecard widget. Ensure that cluster-cap file is selected for interactions mode. If not select is from the drop down and click in save and then click on any cluster in the ovject list.
LikeLike
What is the version if vROPs u are using. This is for vROps 6.0 only.
LikeLike
Yeah.. The report of dashboard feature in vROps 6.1 and beyong can only handle a certain screen area, make sure you are within that area to have a single page worth of view
LikeLike
That was it, it was blank. Thanks for the help. The dashboard looks great.
LikeLike
Sweett.. Glad u like it.
LikeLike
any way to get the vCPU:pCPU to take into account HA over heads?
LikeLike
I have enabled this dashboard, it's really nice and thank you. Regarding DISK metric , how can I filter and remove local or unwanted datastores when counting Disk Space – VM remaining ?
LikeLike
Hi Sunny,CLUSTER-CAP.json is not available for download.thanks
LikeLike
The download works for me. Are you blocked by a firewall.
LikeLike
from where i is will get the option for the below Click on Content – > Manage Metric Config -> Expand the folder \”ReskndMetric\” ->VROPS version is 6.6.0.5707161
LikeLike
Hi Sunny,I liked the dashboards and uploaded some of them already, I uploaded Cluster capacity dashboard however issue with view, it shows no values for vcpu, vmemory or any other metrics afterwards, just shows question mark. I am using vrops 6.7, Would you know what could go wrong here?
LikeLike
Hi Sunny,Do you have any similar dashboard which can work with vROPS 7.5 ?
LikeLike