
With this article of the Did You Know series, I wanted to share a GEM of a feature using which can enhance your user experience and user interface of vRealize Operations Manager. If you have used vRealize Operations Manager, you will notice that the product has summary pages for each object type. For instance if you are on vSphere World Object, you would see a Summary Page which looks like this:
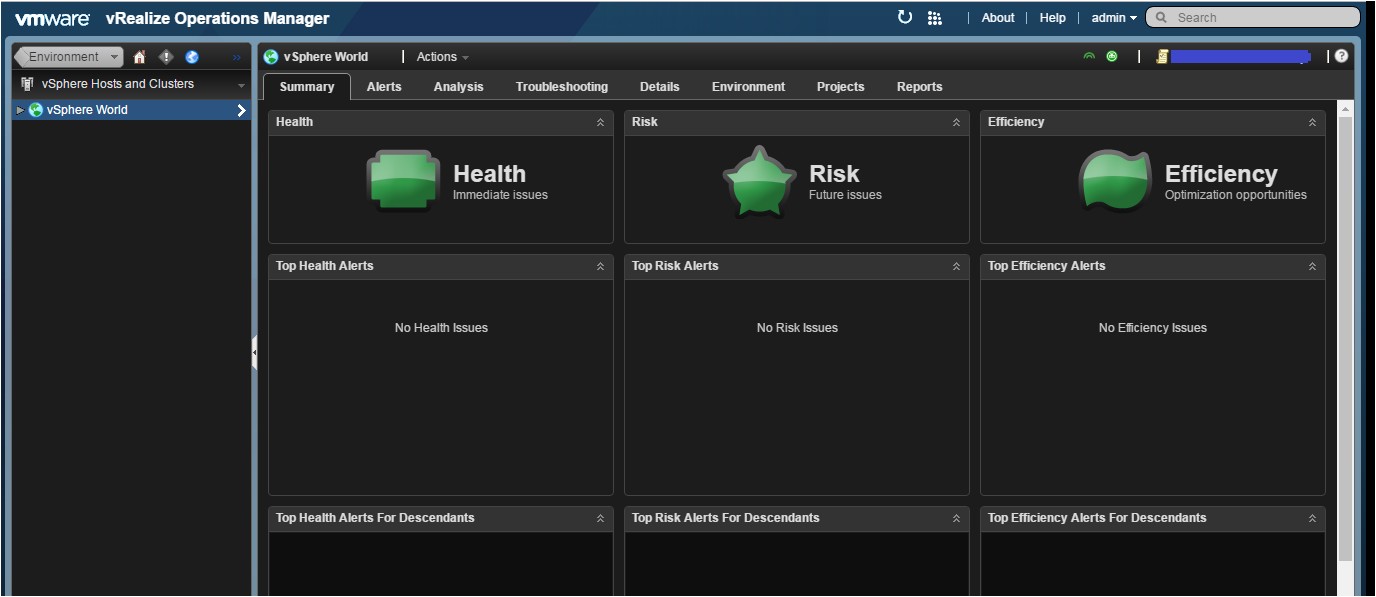
In-fact, if you click on any other object types such as vCenter, Datacenter, Clusters, Hosts etc. you would see a similar summary page showing the Health, Risk & Efficiency of the Object Type which you have selected. The Health, Risk & Efficiency badges on this page are colored based on the Alerts triggered on the Object type which you have selected on the navigation pane in the left.
While this view is useful to summarize the alert status, this might not be the default page which you want to see when you select an object type. If that is the case, vRealize Operations Manager provides you the option to change this default summary page to the dashboard of your choice (I have seen this feature on vROps 6.2 and 6.3). In my opinion this is a super cool feature as now yo can create your own summary pages using vROps Custom Dashboards and then use them as default summary pages (only applicable to license editions where you can create custom dashboards)
Here is how you do it:
Create a custom dashboard for the object type which you want to chose as the summary page beforehand.
1- Login to vRealize Operations Manager using Administrative Privileges. (preferably admin account).
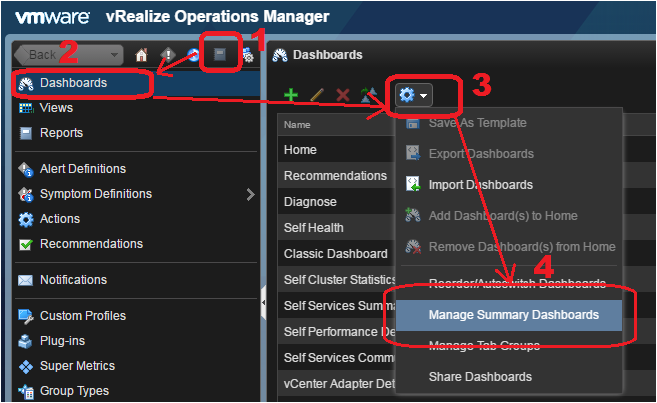
2- Click on Content -> Dashboards -> Blue Wheel Icon -> Manage Summary Dashboards
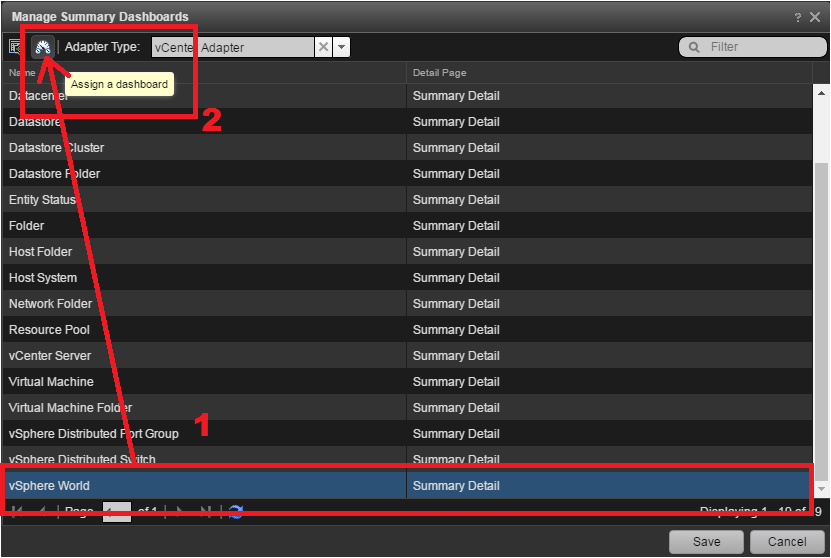
3- Click on the drop-down to select the Adapter Type under which you want to select an Object Type for which you want to change the summary page.
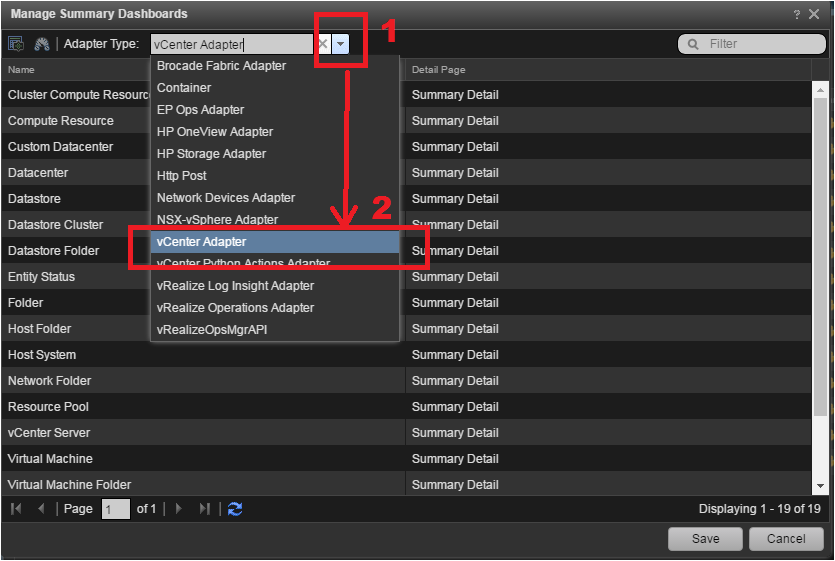
4- In my case I want to change the Home Page for the vSphere World and hence I will select the vCenter Adapter, which will list all the object types under that adapter.
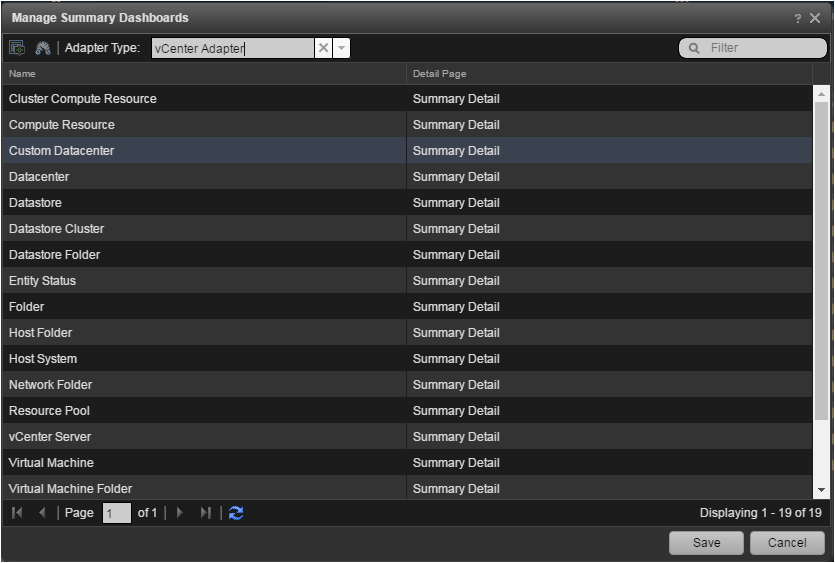
5- We will select the vSphere World from this list and click on the gauge shaped icon to Assign a Dashboard for this Object Type.
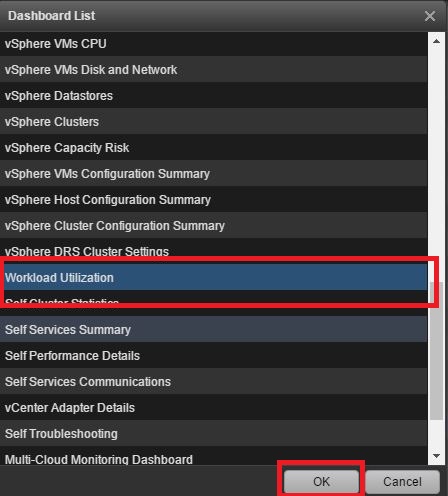
6- Once I click on that icon, I will get a list of all the dashboards I have in my vROps instance. I will go ahead and select the dashboard which I wish to chose, in this case I will select the Workload Utilization dashboard and click on OK to save the changes.

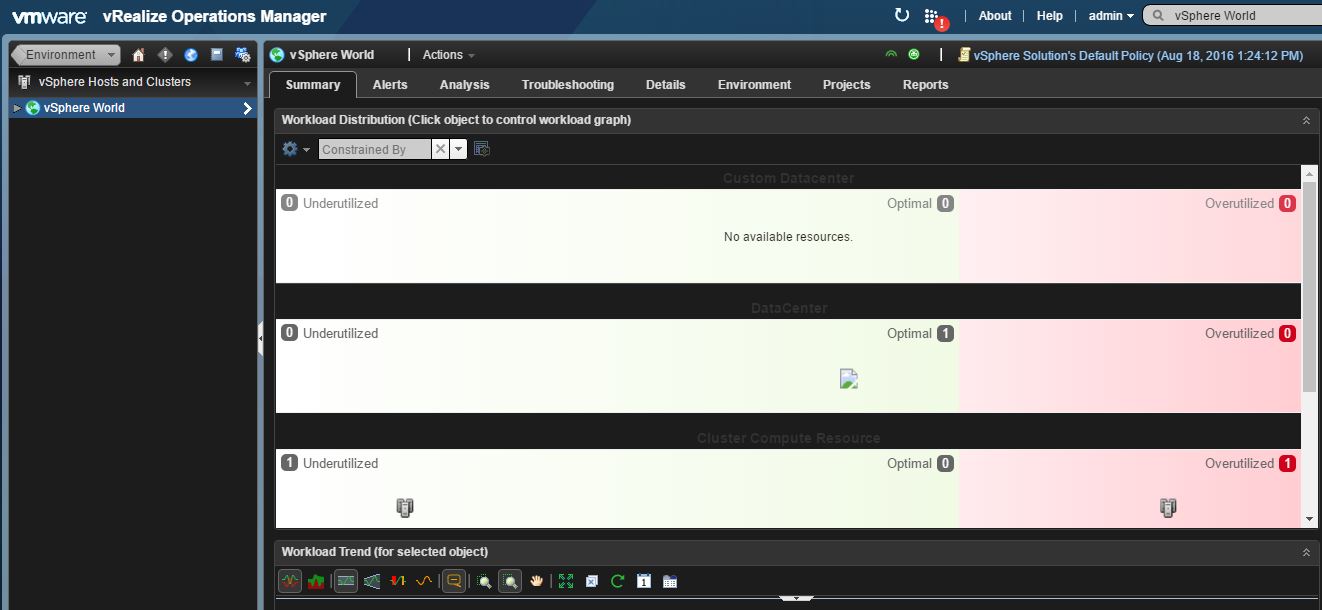
6- Let’s go back to vSphere World and see how the summary page looks like after this change. Click on Environment -> vSphere Hosts and Clusters -> vSphere World.
You can now see a completely different home page than what you usually see.

This will help you enhance your instances of vROps with you self customized dashboards and help you jazz up your deployment with personalized views at each object level..
Hope this helps with day to day data-center operations using vRealize Operations Manager.
Stay tuned for more goodies!!
