Let’s explain this with an example. I am currently looking at the CPU Usage of one of my virtual machines here using a metric graph. This is the last 7 days worth of data showing the regular patterns of how CPU is being used. You can see the peaks and valleys. Upon observing closely, you can see that the data patterns are pretty consistent.
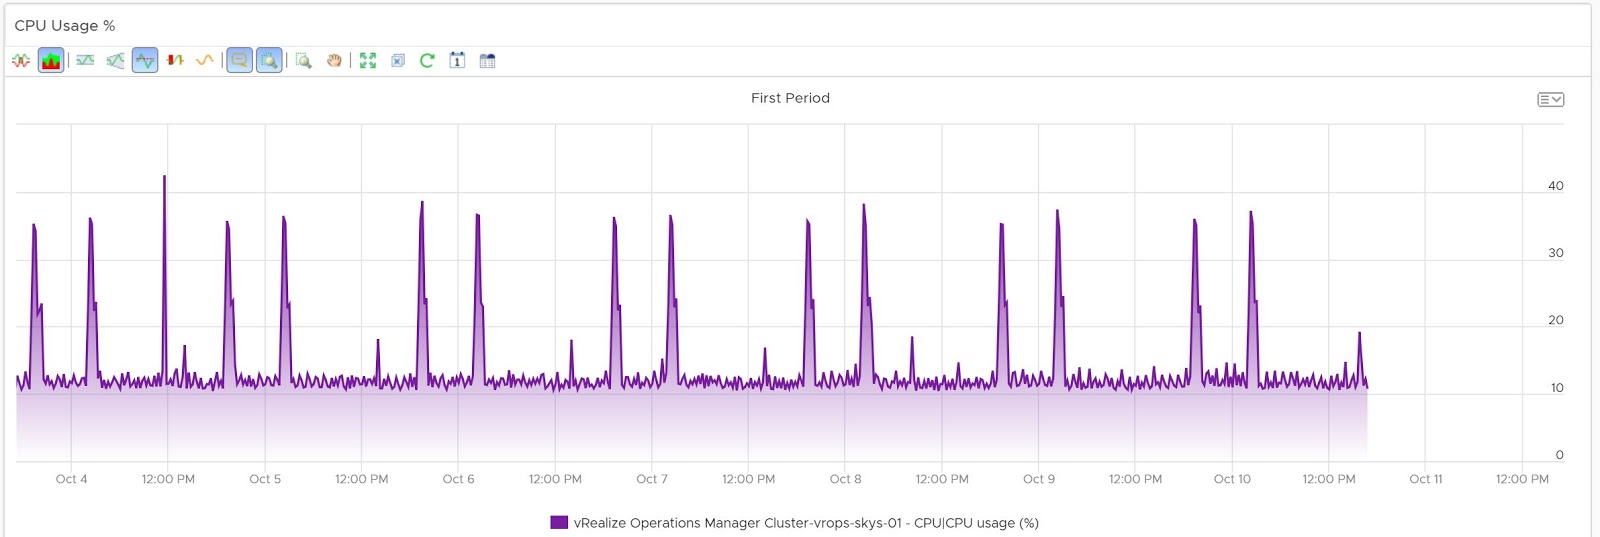
Imagine, I need to quickly look at how was the behavior of this metric at exactly the same time-period A WEEK AGO. I want to compare to see if things have changed, or is their any anomaly in the data pattern..
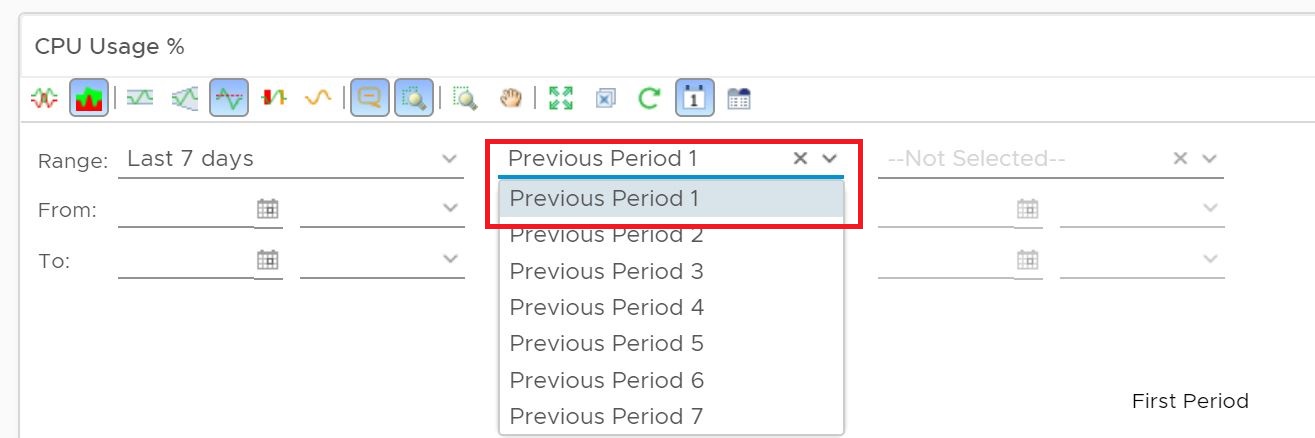
Alright, I will click on the calendar icon and from the second date time control chose 1st Period:
Let’s click on GO and see what happens.
oooh.. look at that, I am now comparing to a previous period.. But this seems a little harder to compare in this mode.
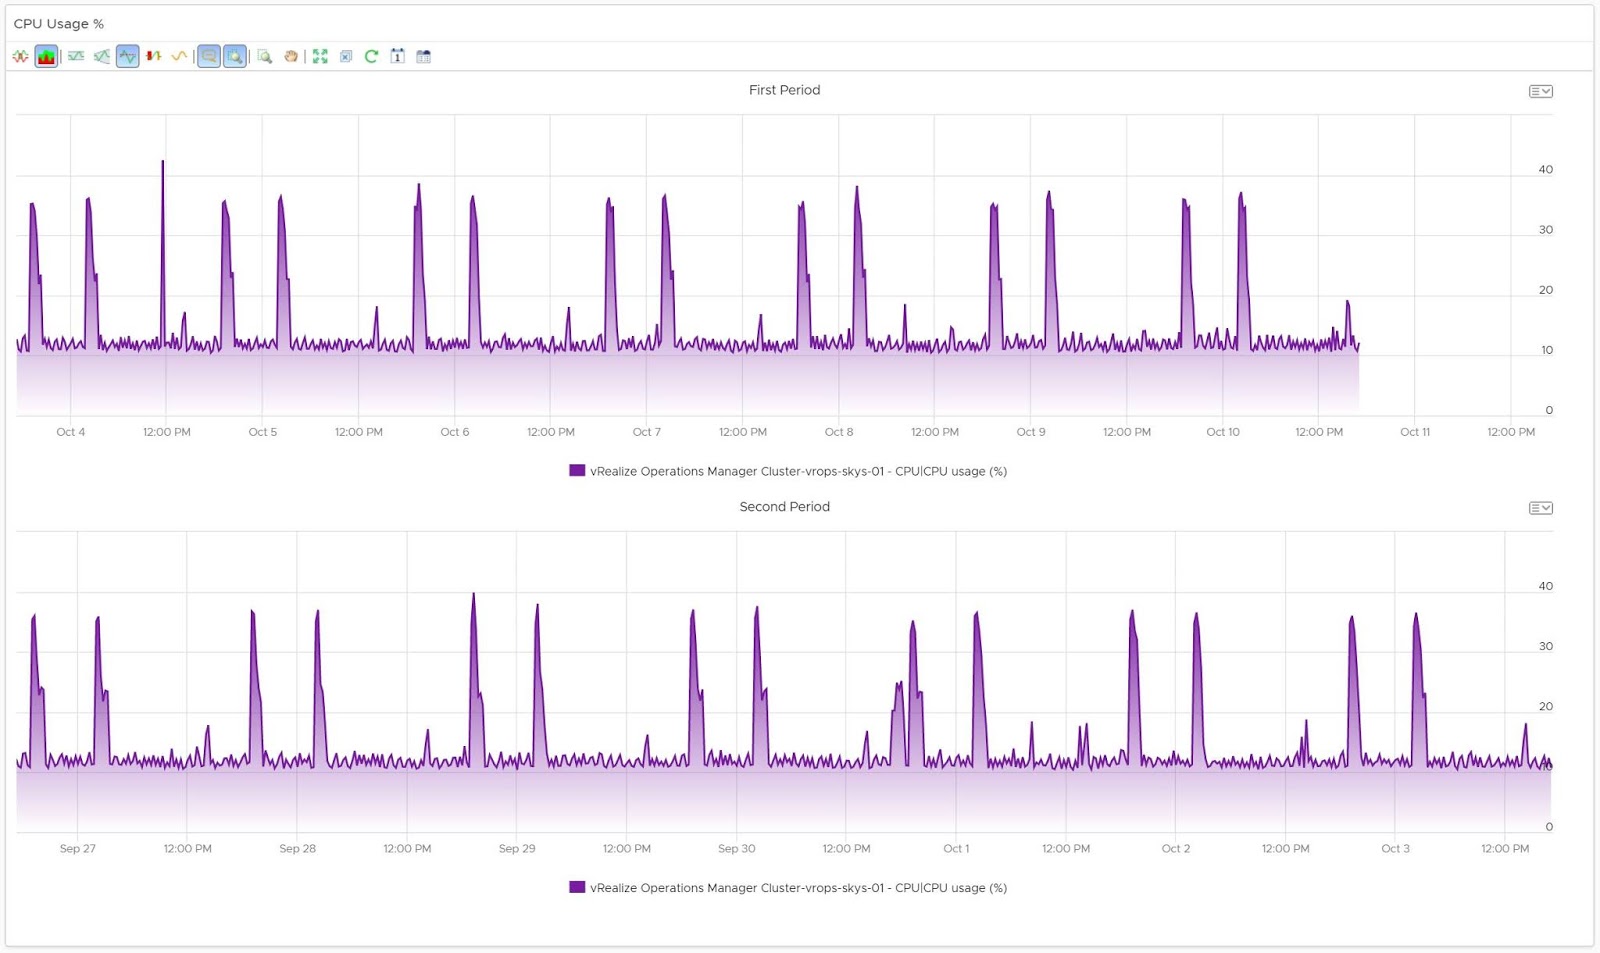
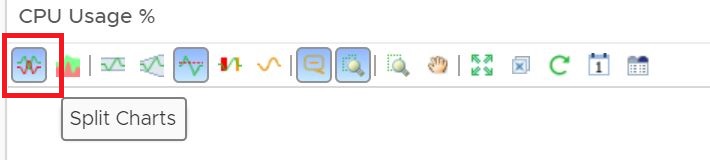
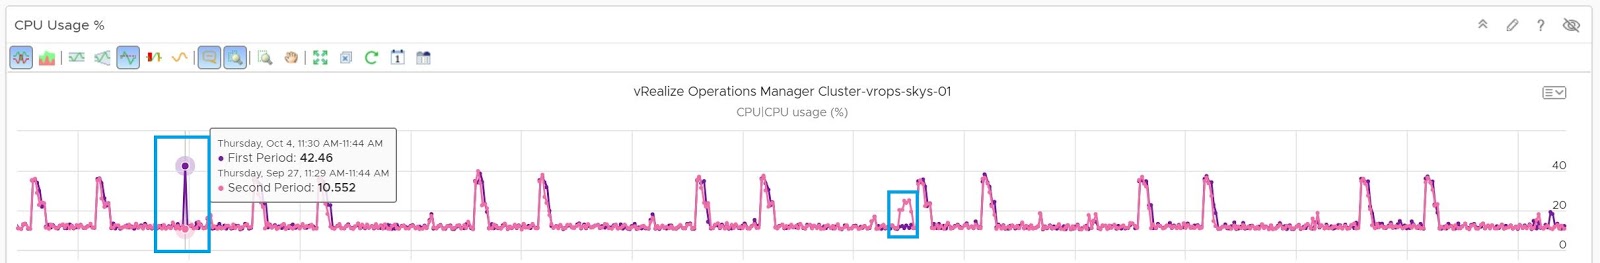
Let’s click on the split charts option to compare these charts in a single graph:
Bingo… Look at that… We immediately found atleast a couple of data points where the CPU Usage is abnormal as compare to what it is this week.
If by now, you are thinking, what happened the week before that, then you my friend are thinking exactly like me 🙂
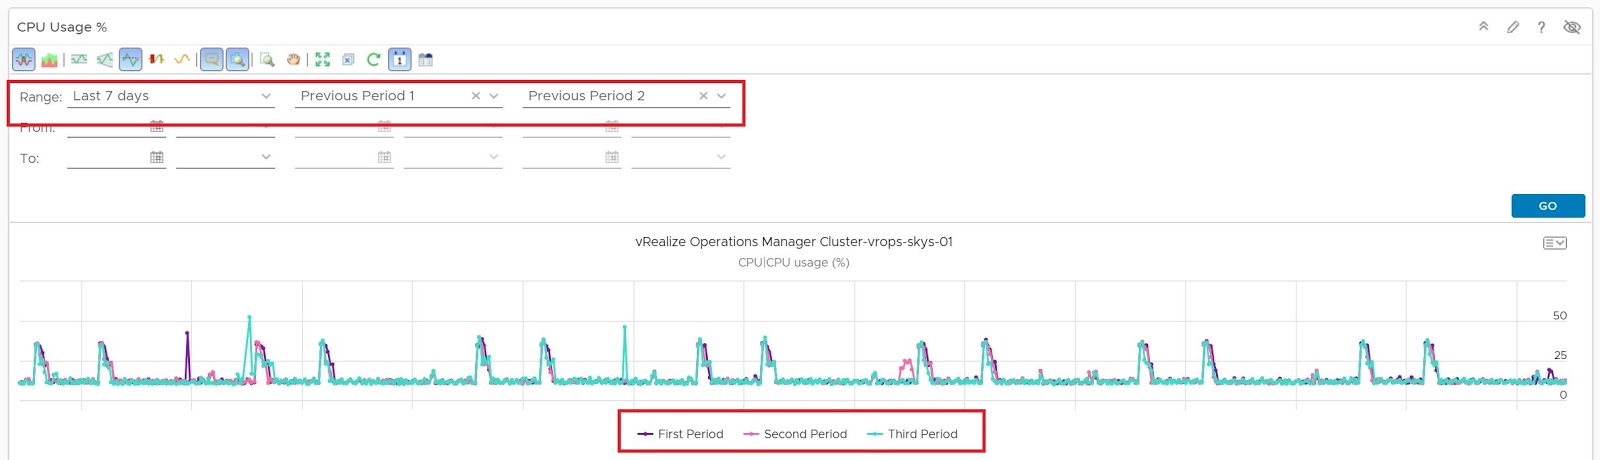
Let’s get one more week in by adding “previous period 2”.
Easy Peasy… A quick and easy way to get value out of vRealize Operations.
Well, I hope this gives you some ideas to how manual troubleshooting which ofcourse is a day to day operation done by admins and architects can become increasingly simple yet effective by using these hidden gems or vRealize Operations.
Share and Spread the knowledge and do share your troubleshooting techniques with vRealize Operations….
